How Can We Help?
Your dashboard provides a snapshot of the performance metrics related to your audio tours. It helps you evaluate how well they are doing and plan for future improvements.
Tour data
The tour data section shows you how many visitors your site has served with audio tours in the past day, thirty days, this year, and the total number of tours.
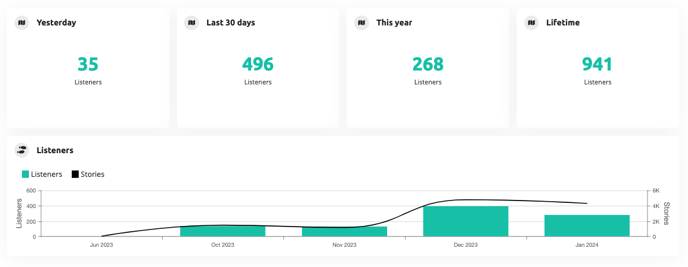
Tours played
The tours played graph offers a detailed breakdown of the number of tours served throughout the past year. This information is further segmented based on the platform used, allowing you to analyze tour consumption across different channels such as the Podcatcher and PWA.
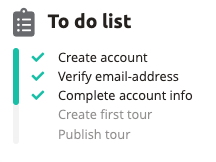
To do list
Lastly, the to-do list feature guides you through the necessary steps to ensure your audio tours are ready for your visitors. This convenient checklist helps you stay organized and ensures a seamless experience for your audience.