When you and your visitors use the tours you have created on the Guide-ID Platform, the system automatically collects analytics data.
These metrics are invaluable for evaluating the performance of your tours, stops, and clips, as well as analyzing user engagement with quizzes and surveys.
Finding the analytics page
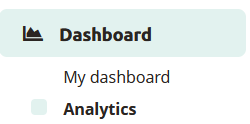
Upon logging in to the Guide-ID Platform, you will land on the Dashboard. To navigate to the Analytics page, simply locate it in the sidebar below the Dashboard section.
 Tours
Tours
Within the tours tab, you will find a collection of informative graphs that provide key details about your tours. These include the number of tours played, the total number of stories shared, the duration of each tour, and the average number of stops visited per tour.
Stops
The stops tab offers valuable insights into the most and least played stops, as well as the triggers that prompted their playback. Popular stops typically indicate visitor preferences, while less frequented stops may be situated in less accessible areas or encountered when visitors are fatigued from the tour through the museum.
Clips
This section provides information on the chosen options and how they compare to alternative choices, offering valuable insights into visitor preferences.
Alarms
In the alarms tab, you can monitor the frequency at which alarms were triggered and identify the most commonly activated alarm (if multiple alarms are set up).
Group tours
This is subscription based for Podcatcher Pro clients. For questions please contact our Helpdesk or one of our Business Managers
Heatmap
This section provides information about visitor counts and percentages for the selected tour stops.
You can select a month and year and then choose a specific tour.

The stops for the selected tour are displayed in a table, organized by day.

The table shows listening rates as percentages. To switch between percentage values and visitor counts, click the Toggle Visitor Count/Percentage button.
The color of the table cells varies based on the listening percentages

Export
From the Export tab, you can download analytics data about stops yourself, to be used to create your own displays or to combine with data from other analytics platforms you use for your museum. See our Exporting Analytics Data for more information.