
The Alarms page tracks the “return the Podcatcher” reminder alarm — how often it fires, and for what share of listeners. This is primarily an operations and hardware-recovery metric rather than a content metric.
As the page itself notes: the alarm reminds visitors to return the Podcatcher; the count is how often it fired.
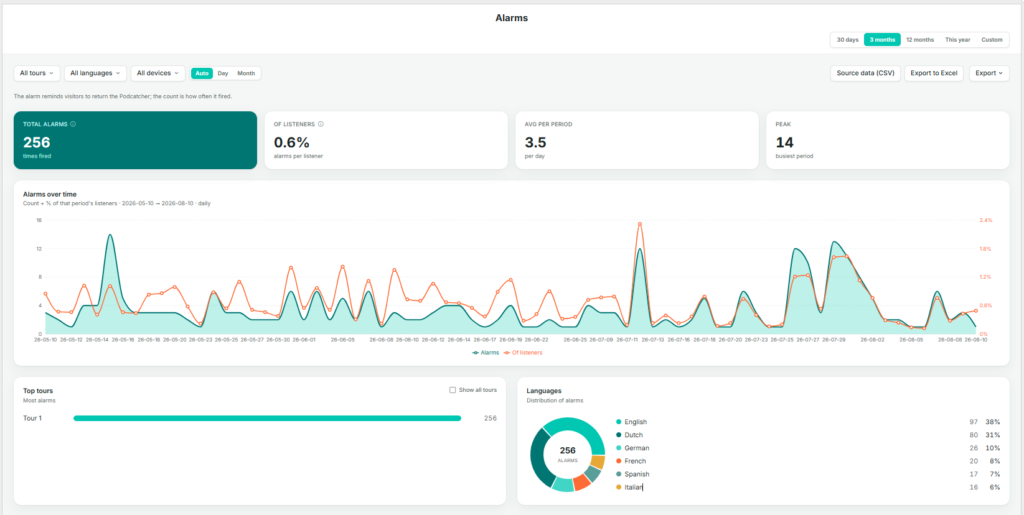
Key Metrics
- Total alarms — the number of times the alarm fired during the selection.
- Of listeners — alarms as a percentage of total listeners, indicating how often a session ends in a reminder alarm rather than a standard return.
- Avg per period — the average number of alarms per day, or per the selected granularity.
- Peak — the busiest single period for alarms within the selection.
Alarms Over Time
A dual-axis daily chart showing alarm count (area) alongside the percentage of that period’s listeners (line), making it possible to see whether alarm counts are rising because of higher visitor numbers or because a larger share of visitors are forgetting to return devices.
Top Tours
The tours generating the most alarms, ranked, with Show all tours to expand the list.
Languages
A donut chart and list of alarm share by language, useful for identifying whether one language group tends to forget devices more often, which may point to unclear instructions or a translation gap rather than a behavioral difference.
Use Source data (CSV) of Export to Excel on this page to share alarm trends with your hardware or operations team, particularly ahead of busy periods where late returns can cause delays at handback.
 Nederlands
  English
  Français