Introduction
The Selected Options reports give insight in the ABC choices your visitors make, for example in questionnaires.
Selections
Tour: Select the Tour you want to view
Selected stops / questions: For all stops in the selected tour, the Clips that have an A, B or C choice are listed. You can (de)select all clips of a stop by (un)checking the checkbox next to the stop title.
From and Until: Select the time period for the data you want to view.
View chart: Generate the charts for the selected questions.
When no chart is presented, but “No data” is shown, there were no A, B or C responses recorded during this period for the the selected questions.
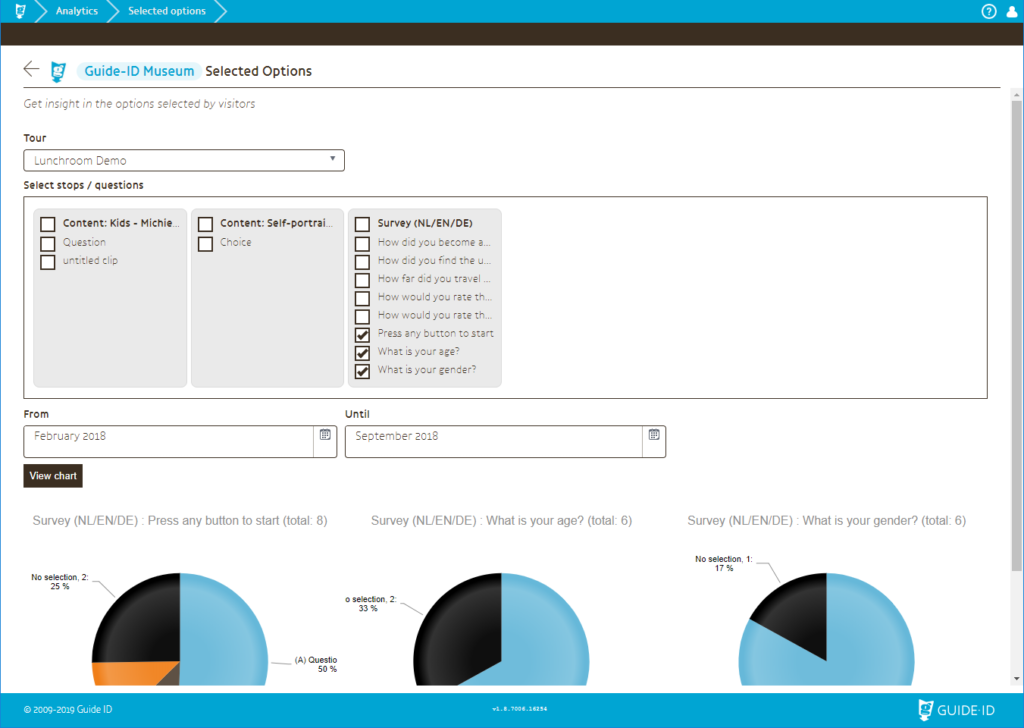
Charts
Title: The title shows the total number of times the question clip is started by the visitor Podcatchers. Only the first time a a visitor listens to the question clip is counted.
Pies: Every chart shows a maximum of 4 pie slices. One for every button and one for “No selection”. If there are no recorded responses for this question, no pie is shown.
The label shows the name of the clip that was started after pressing the button. At the end of that label you can see the number of times this answer was chosen.